
Rear Wing Redesign: Closing the Sim-to-Track Gap
ClientEESC-USP Formula SAE
- CFD
- Aerodynamics
- Vehicle Dynamics
Result
2.7 → 4.1
Aero efficiency
−15%
drag
+45%
max downforce (DRS active)
The problem
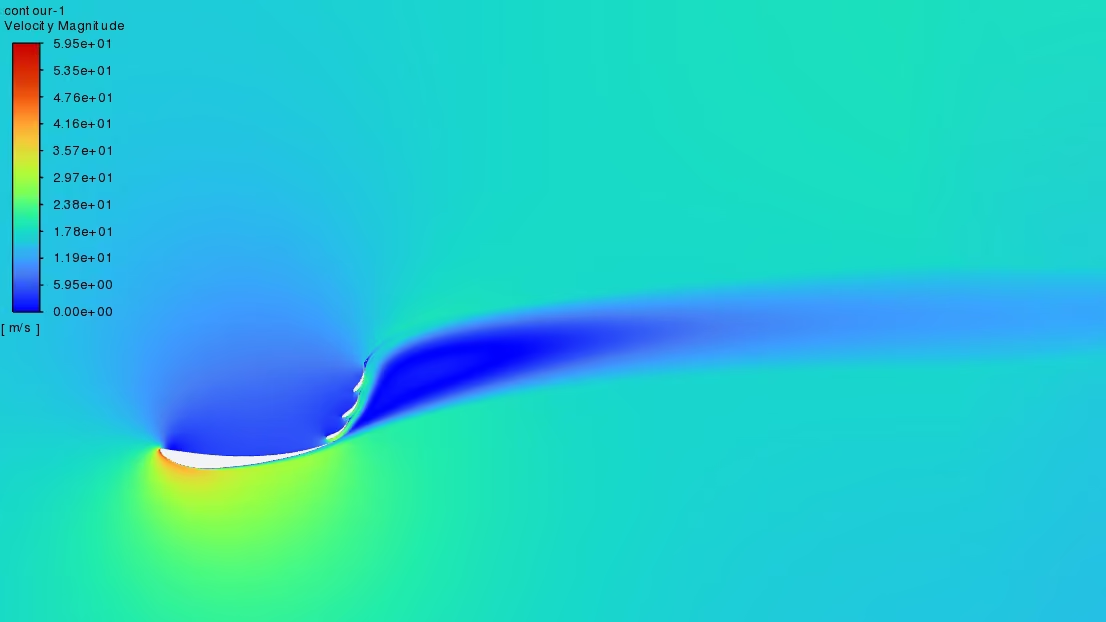
During the 2019 season, telemetry showed balance deviations in medium- and high-speed corners that the team’s full-car steady-state simulation hadn’t predicted. Driver feedback pointed at the rear wing; wool-tuft and flow-vis testing on track confirmed it — strong flow detachment on the main plane that the full-car simulation model simply wasn’t resolving.
Approach
Rather than trust the full-car model further, I built a simulation focused specifically on the rear wing: all static and moving surrounding components included, an overset mesh method to merge the static and dynamic component meshes without introducing deformities, and a transition shear-stress-transport turbulence model chosen specifically because it handles the complex boundary layers, detached flow, and oscillating vortices this geometry produces.
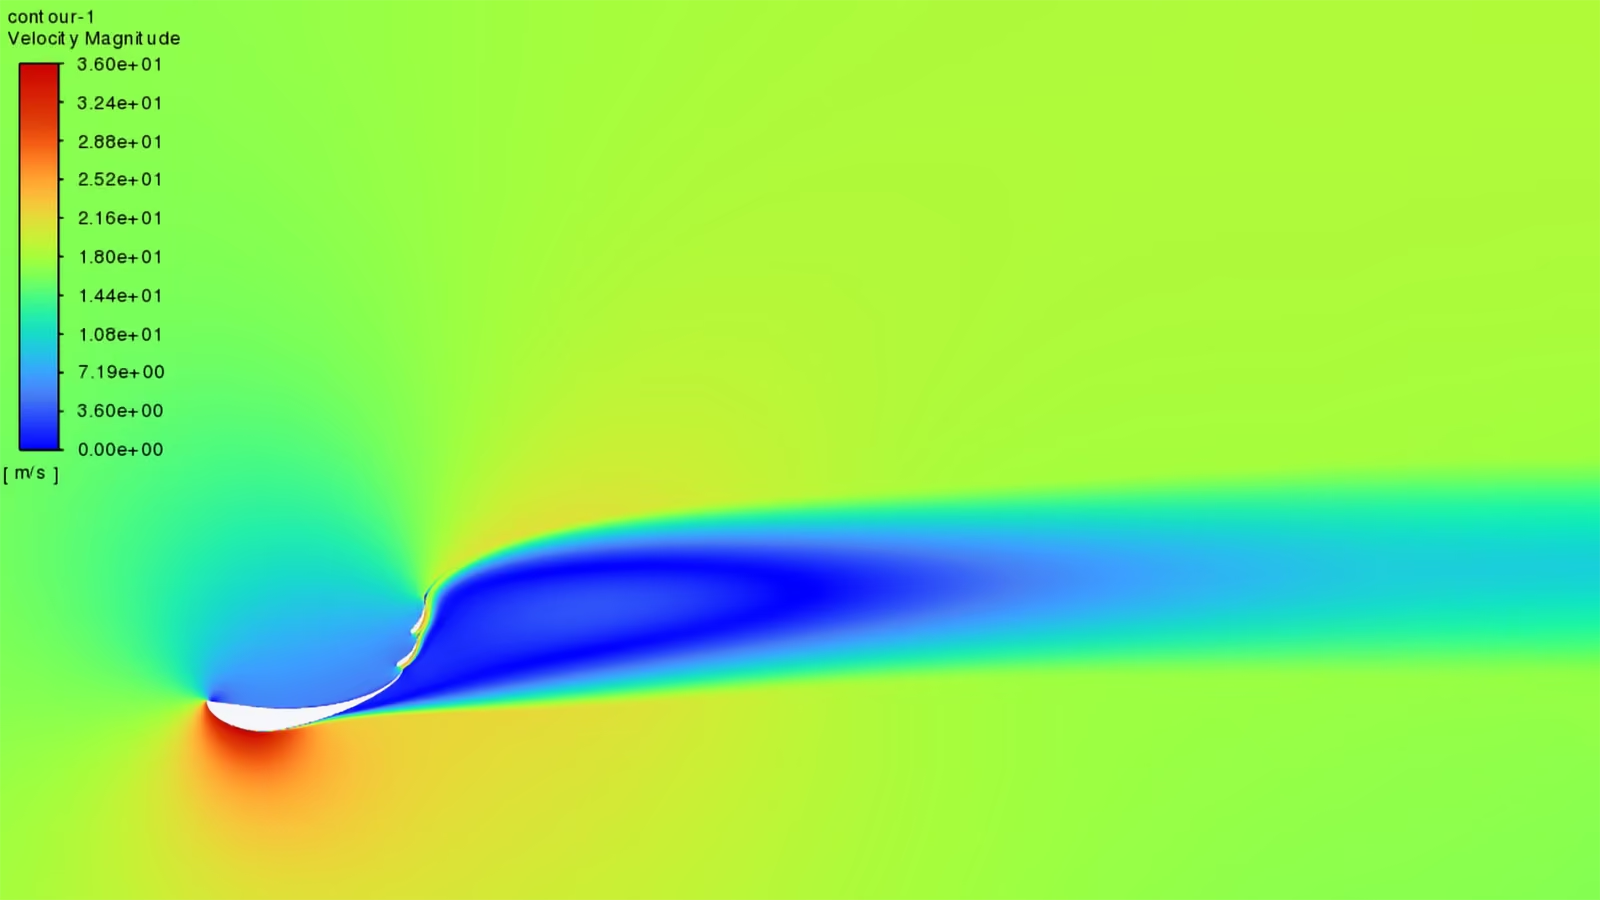
The focused simulation reproduced the track-observed detachment and traced it to the main plane’s excessive thickness and camber. That diagnosis drove a redesign: a new main-plane and endplate geometry, plus an added flap.
Result
The redesign lifted the car’s simulated aerodynamic efficiency from 2.7 to 4.1, cut drag 15% with DRS active, and increased maximum downforce by 45% — with the car handling more predictably in exactly the corners where the original data anomaly showed up. It also fed back into the endplate design, replacing the trims with gurney flaps to better exploit the category’s regulations.
Why it matters for your program
When simulation and track (or test-bench) data disagree, the fix usually isn’t a better full-system model — it’s a focused, correctly-scoped simulation of the specific component in question, with the right turbulence model for the physics actually happening there.
Compare
Drag to compare the two cases
Have a similar problem?
Aero efficiency 2.7 → 4.1, −15% drag, +45% max downforce (DRS active). Tell me what you're working on and I'll tell you directly whether and how I can help.
I reply to every enquiry within one business day.
+55 16 99785-1402